As expected for a first row transition metal,
the manganese atom in Mn2(CO)10
shows only three shells of charge concentrations in L(r).
The 3d electrons are subsumed with the core 3s and 3p into the inner
valence shell charge concentration (i-VSCC), which is distinctly
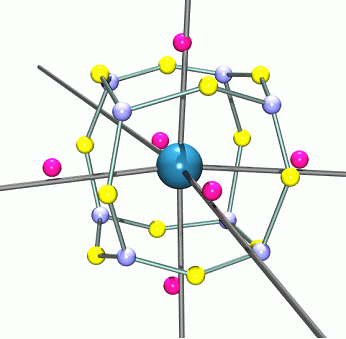
non-spherical. The (3,-3), (3,-1) and (3,+1) critical points in L(r),
in the region of ~0.33-0.36 Å from the nucleus,
constitute the atomic graph.
The cuboidal form, with the eight
charge concentrations maximally avoiding the ligand charge
concentrations, is the one most commonly
observed for transition metals
The graph is consistent with the
the qualitative expectations of ligand field theory,
in that the core-like 3d electrons avoid the charge concentrations
of the carbonyl ligands. It is interesting to note that the charge
depletions do not exactly coincide with the Mn-Ligand vectors, but are
more closely opposed to these vectors.
The graph is very similar to that observed for HMn(CO)4(PPh3), and provides further confirmation of the covalent nature of the Mn-Mn bond.

|
Figure 1. The atomic graph of the Mn atom in Mn2(CO)10. The pink spheres represent the (3,+1) critical points of charge depletion, the light blue spheres the (3,-3) critical points of charge concentration and the yellow spheres the saddle (3,-1) critical points in the Laplacian L(r) |

|
|
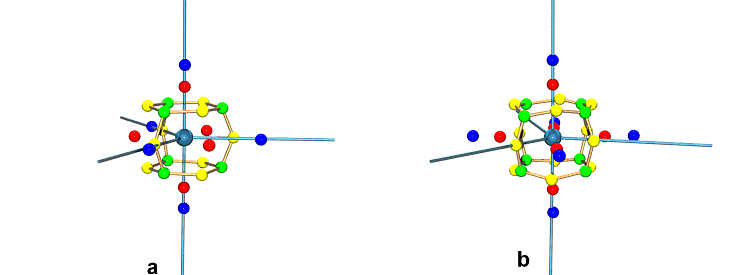
| Figure 2 Atomic graph of the Fe atom in Fe(CO)5 from (a) gas phase quantum density (b) experimental multipole pseudoatom with just the required C2 site symmetry. The colour coding is green (3,-3), yellow (3,-1), red (3,+1) and blue (3,+3). |
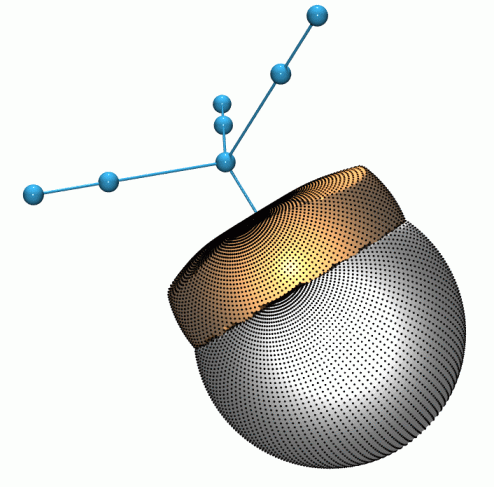
The interatomic surfaces of the terminal C and O atoms in metal carbonyls are quite reproducible and are indicative of the strongly polarised bond. The surface lies much closer to the C atom, resulting in a large positive charge, generally ~ 0.9-1.0 at the C atom, with a larger negative charge ~ -1.1 for the O atom.
