Publishing Results
Click here to find out how to optimise dSNAP and PolySNAP graphics displays for publication.
Compare programs
Click here for an overview comparing dSNAP, PolySNAP and PolySNAP M.


SNAP software is developed by the
Theoretical Crystallography group at the University of Glasgow, and is
exclusively distributed by Bruker AXS.
PolySNAP 3 Features Summary
See all of PolySNAP 3's key features - Detailed PDF [2.1Mb].
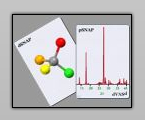
PolySNAP3 is a computer program for the classification of powder diffraction, spectroscopic and numerical data either separately or combined. Cluster analysis, multivariate data analysis and extensive data visualiza- tion routines are used to automatically classify the patterns into groups, validate the classification, and thus identify polymorphs, mixtures and salts.
Multiple Data Set Analysis
- Look at up to four datasets in a single run
- Each dataset can have up to 1,500 samples
- Pre-screen a large dataset of over 100,000 samples to find the subset most relevant to a new unknown sample
- Work with PXRD, Raman, IR, DSC, other numeric data
- Work with different datatypes individually, or get a combined analysis overview
- Comparison of a selected pattern to a user-defined database
Pattern Matching:
 Analysis
of many patterns in a single run
Analysis
of many patterns in a single run- Comparison of all patterns with each other
- Comparison of a selected pattern to a user-defined database
- Use of simulated patterns when experimental profiles are unavailable

Data processing:
 Background
subtraction based on n-th order polynomial
fitting
Background
subtraction based on n-th order polynomial
fitting- Noise-reduction
using state of the art wavelet-based
techniques
- Masking of
unwanted 2Ø regions to remove impurity or
internal standard peaks
- Optional
peak location marking
- Refinable
x-offset parameters

Results Visualisation:
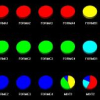
 Colour-coded cell displays
represent results
Colour-coded cell displays
represent results- e.g. a 96-well plate
- Colour-coded pie chart for display of quantitative analysis results
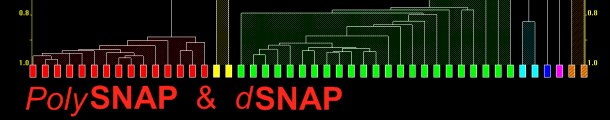
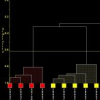
- Dendrogram display for similarity analysis
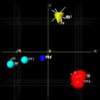
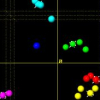
- Fully interactive rotatable 3D plots
- different samples of the material visibly cluster together
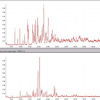
 Pattern overlays and difference
plots
Pattern overlays and difference
plots- Modified 3D plots to additionally display sample preparation information
- e.g. solvents, reaction times, etc.
- Integrated sample picture display
- Colour-coded tables of raw numerical results


 Automated
report writer (RTF, HTML)
Automated
report writer (RTF, HTML)- Automatic creation of reports incorporating program settings, results, and display screenshots
- Time/date stamped logfile to assist with audit trail procedures
- Full clipboard support
- Integration with other Bruker software
