Compare programs
Click here for an overview comparing dSNAP, PolySNAP and PolySNAP M.


SNAP software is developed by the
Theoretical Crystallography group at the University of Glasgow, and is
exclusively distributed by Bruker AXS.
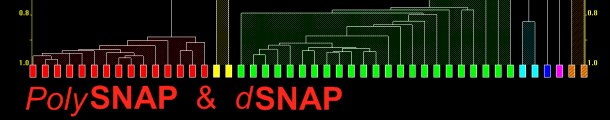
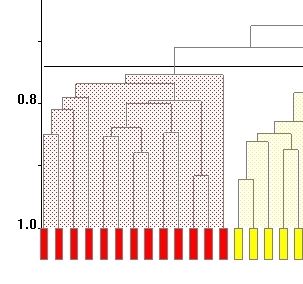
Publishing graphics from PolySNAP and dSNAP
Using results graphic displays from PolySNAP and dSNAP in other programs is easy - just right-click on any graphic and choose Copy to Clipboard.
By default, these graphics are optimised for display on the screen, rather than the page.
If you are using these results displays in other media - for example in a journal article or printed report - you may wish to alter some of these settings.
- Rendering Quality
Click anywhere in the 3D Plots or Cell Display and press F12
to bring up a dialog box to change the rendering quality. This is
normally set low, to speed up rotation when dealing with large
datasets, but increasing the quality will give smoother lines and
better results when printed.
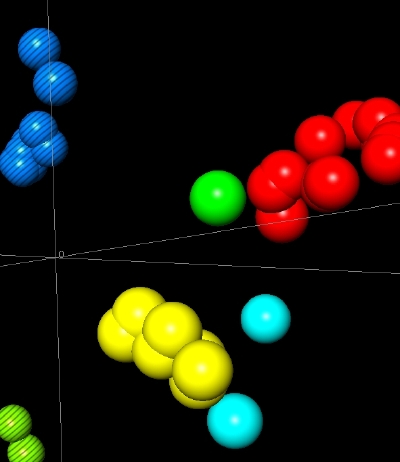
Low Quality High Quality
Low Quality High Quality
- Changing Colours: Background, Axes, Objects
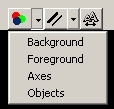 While
dark background colours look good on screen, depending on printing
methods, a white background may be preferred. Right-click on any
graphics pane, and choose Show Toolbar from the pop-up menu. Clicking on the Colours icon brings up a list of items you can change the colour for.
While
dark background colours look good on screen, depending on printing
methods, a white background may be preferred. Right-click on any
graphics pane, and choose Show Toolbar from the pop-up menu. Clicking on the Colours icon brings up a list of items you can change the colour for. Selecting one brings up a standard system Colour Picker dialog box. Select the colour required and click OK.
Background changes the background colour. If changing this to White or another light colour, the Axes should also be changed to a darker colour for best results. Foreground controls the label colours, the main lines in the Dendrogram, and the MRP marks in the 3D plot.
- Line Thickness
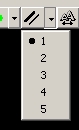 The
line thickness of axes and other plotted lines can be increased,
improving legibility on printing, by selecting from the options in the Line Thickness list on the graphics toolbar.
The
line thickness of axes and other plotted lines can be increased,
improving legibility on printing, by selecting from the options in the Line Thickness list on the graphics toolbar. 1 pixel is the minimum, 5 pixels is the maximum.
- Changing label fonts & sizes
 Clicking the Font icon in the toolbar brings up a standard Font Picker dialog box, letting the font, size and style of the labels be controlled.
- Dragging Labels
Once the 3D plot is set up with the view you want, you can select Drag Labels from the right-click pop-up menu, and manually reposition any labels that are not in an optimum position. Turning off the 3D Gridlines may also help legibility.
The 3D MMDS plots render much better on a black background, but changes in e.g. sphere size, and zooming in to decrease the amount of background, can improve the overall appearance and reduce printing costs of large expanses of black background. We suggest grey axes for MMDS plots.
- Suggested Settings for Print
The 3D MMDS plots render much better on a black background, but changes in e.g. sphere size, and zooming in to decrease the amount of background, can improve the overall appearance and reduce printing costs of large expanses of black background. We suggest grey axes for MMDS plots.